Briefing analysis
User research revealed that the biggest challenge was users’ uncertainty about which metrics to create or how to start their analysis.
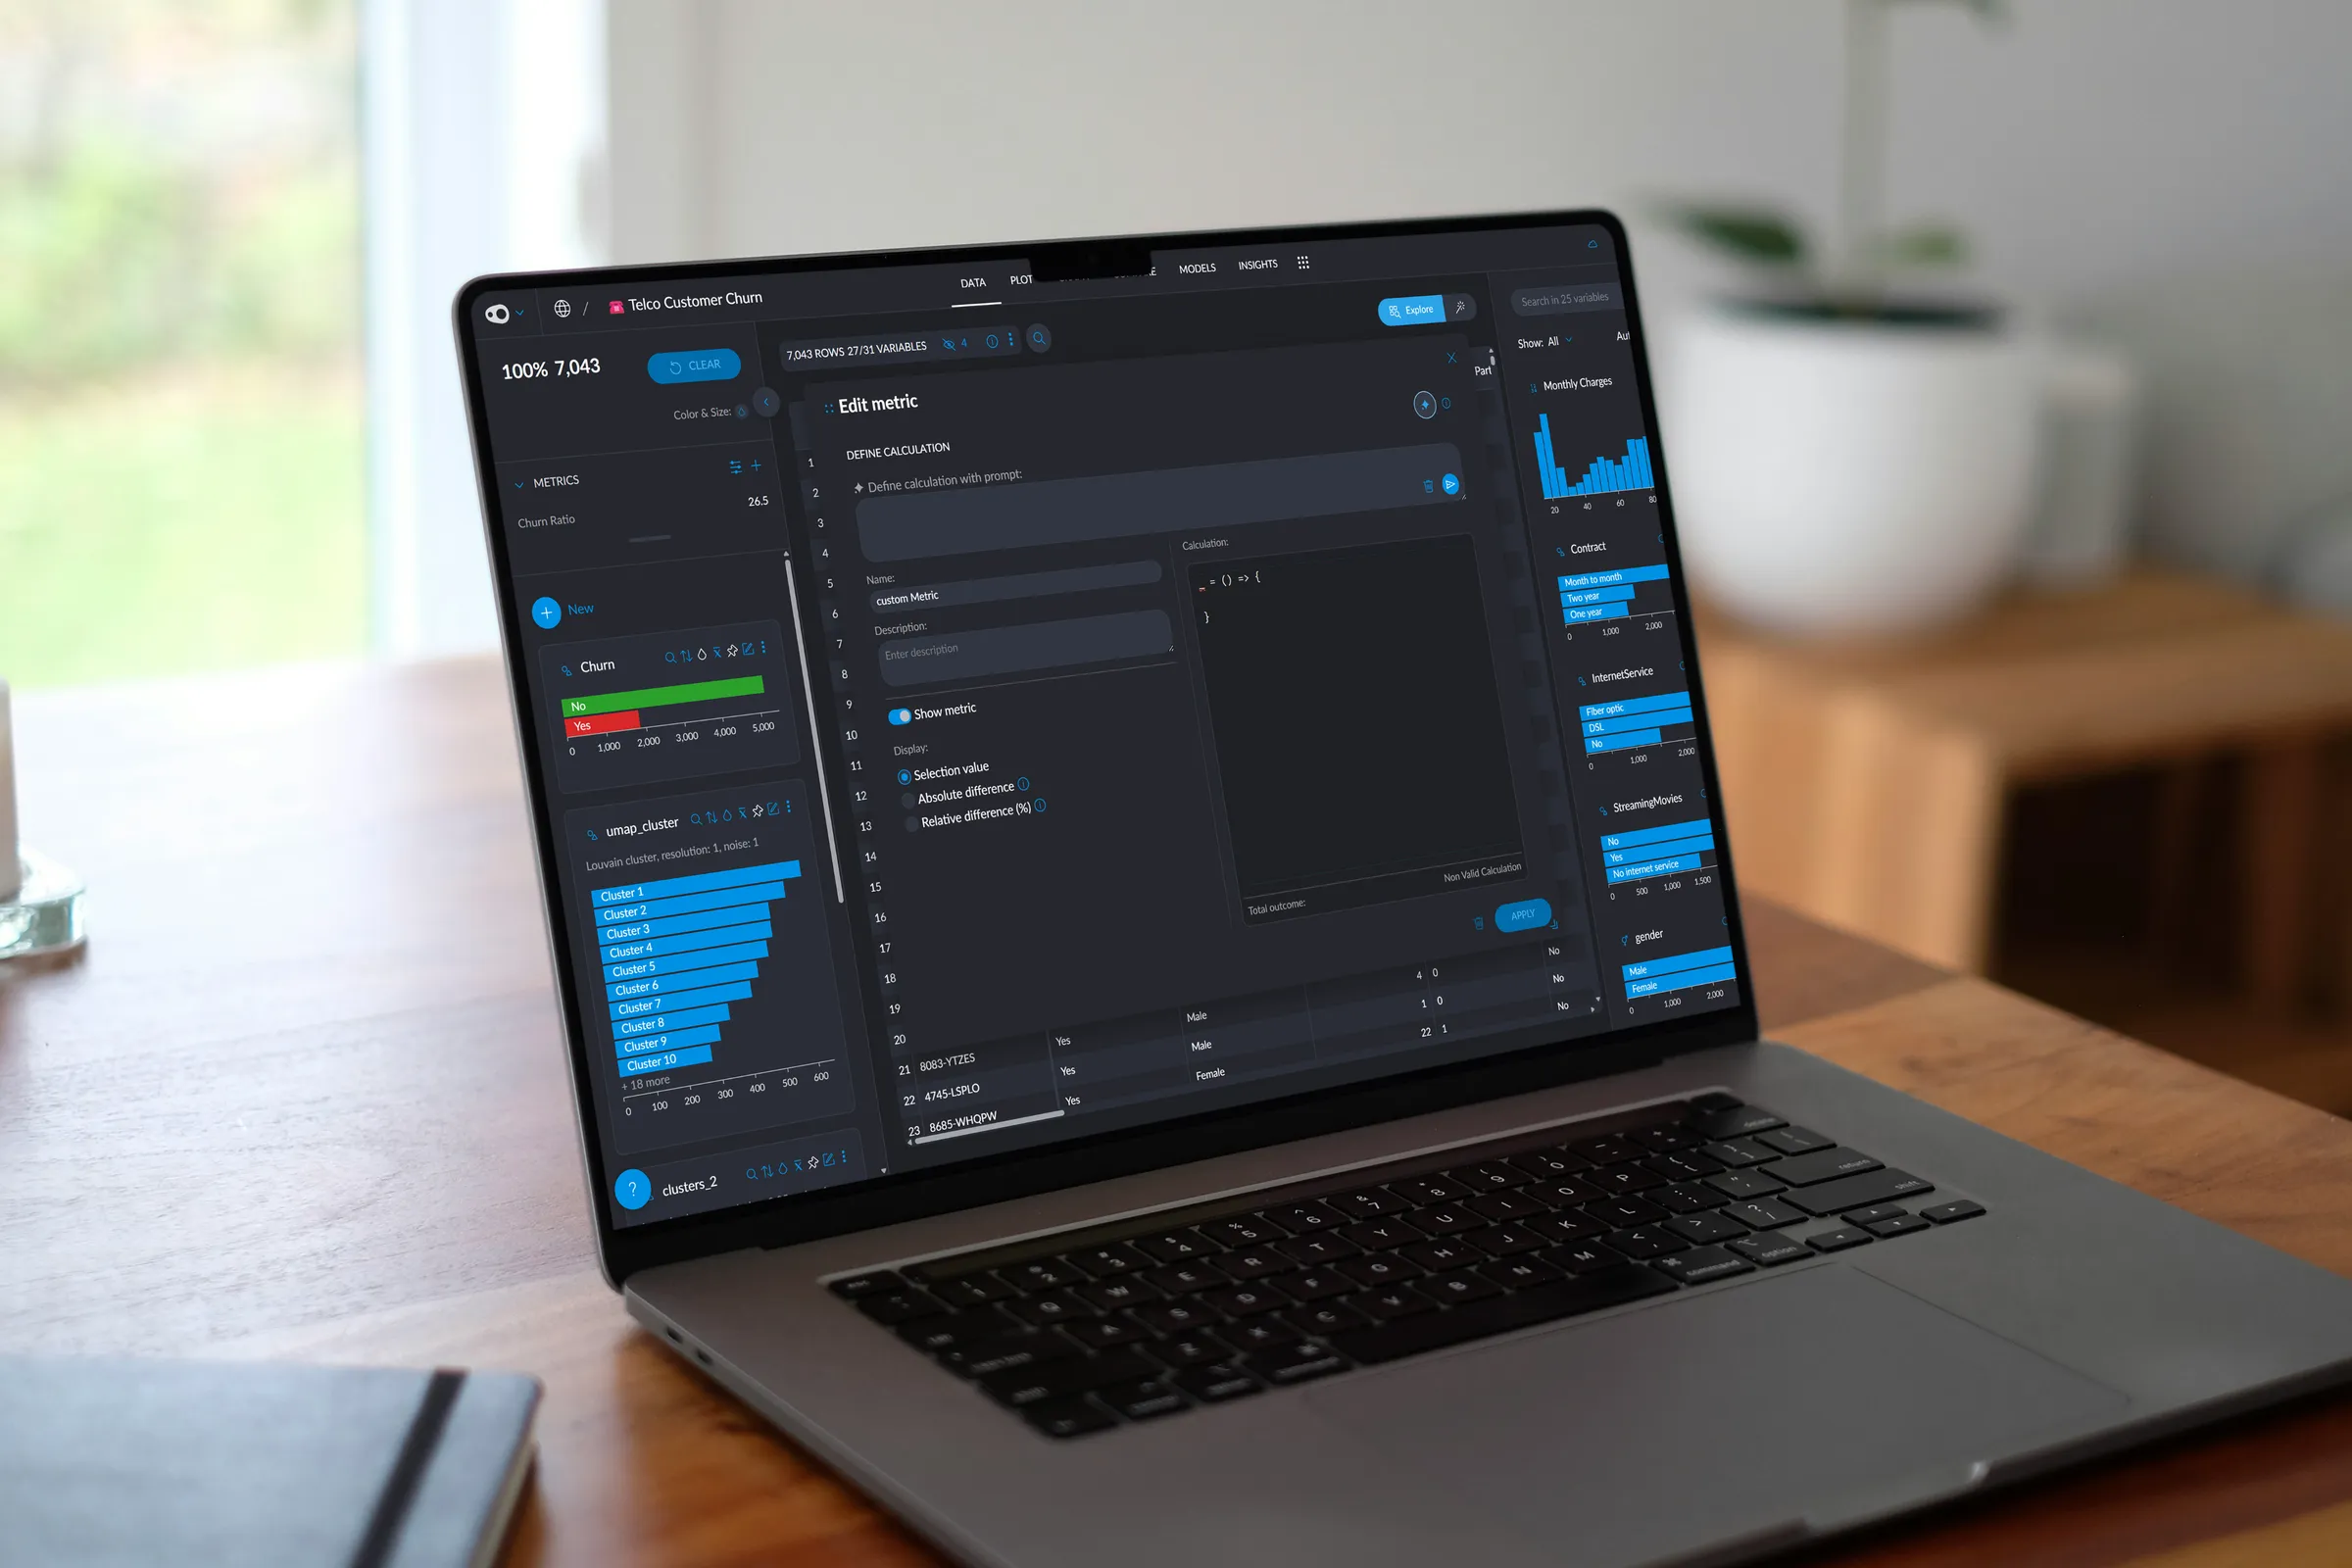
Business clients often struggled to generate meaningful metrics because they didn’t always know what to look for in their data. This lack of direction made it difficult to define and create the metrics that would unlock valuable insights, leading to frustration and limiting the value they could extract from the platform.
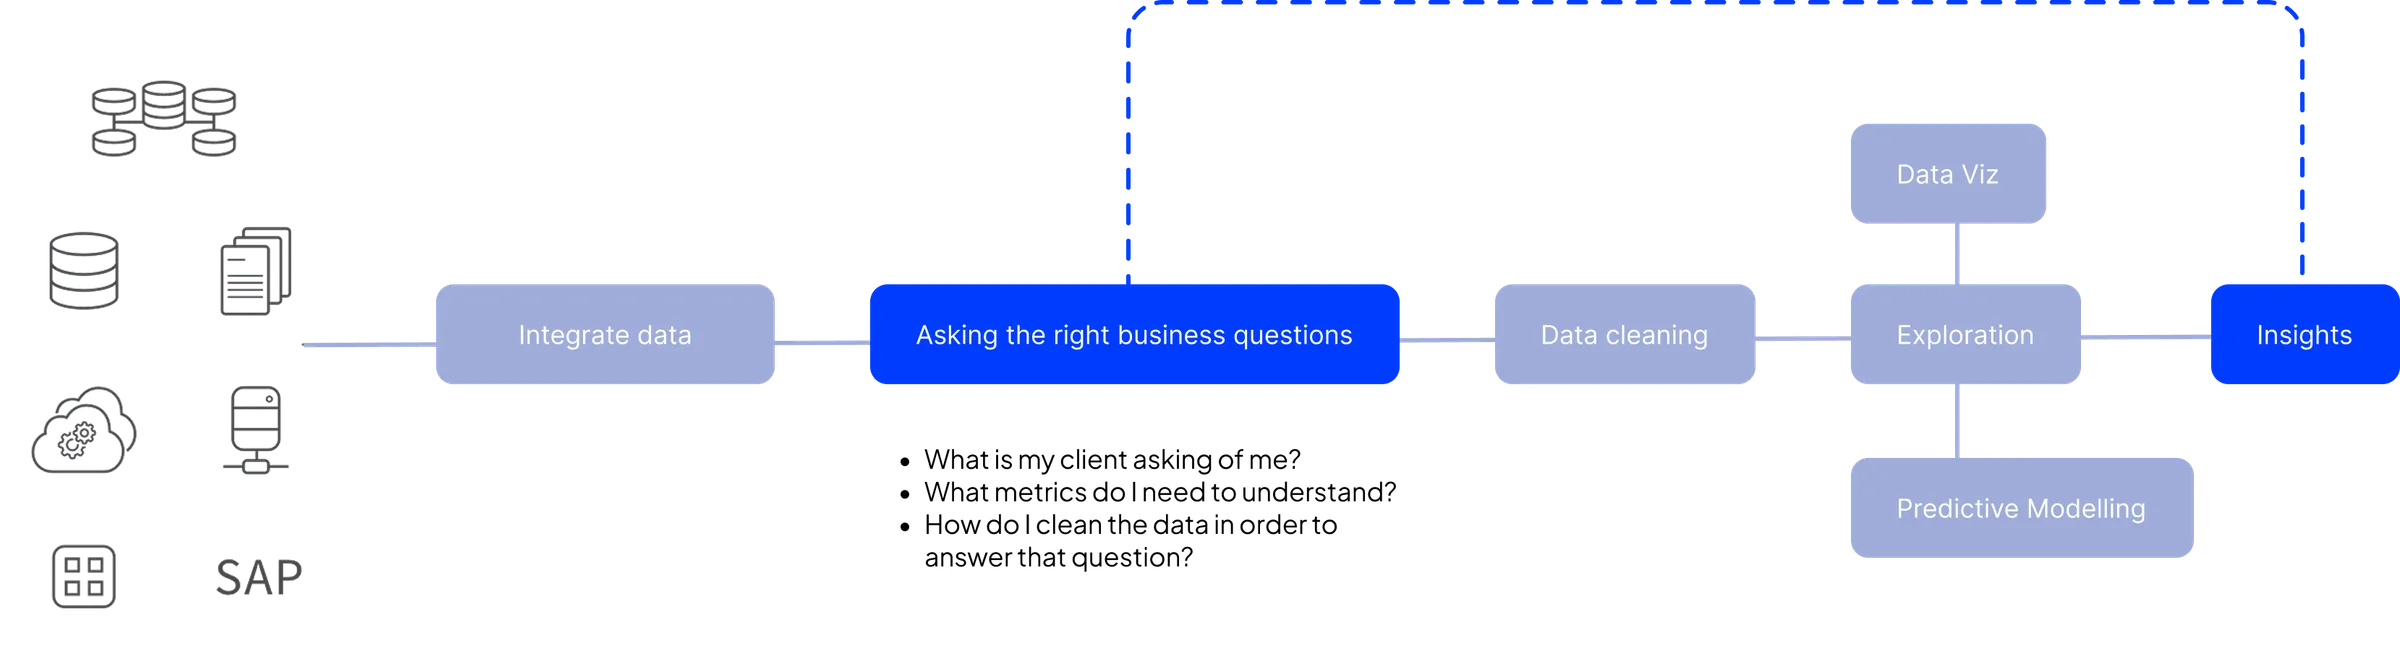
As Product Designer, I worked with development and business teams to create an AI-powered, no-code interaction that guides users — especially those unsure where to start — by suggesting relevant metrics based on their data.
User research revealed that the biggest challenge was users’ uncertainty about which metrics to create or how to start their analysis.
Based on the feedback, I brainstormed several flows that would allow an AI assistant to guide users from a point of uncertainty to concrete, valuable insights.
I made metric creation easily accessible by placing the entry point prominently on the dataset’s Home page.
In designing the AI-assisted flow, I ensured users could still create manual metrics with full functionality.
The final design introduced an AI-powered assistant integrated into the metric creation flow. Users could describe the metric they were interested in (e.g., “What are the average sales by region?”), and the AI would:
*Users can refine or adjust their request using natural language.
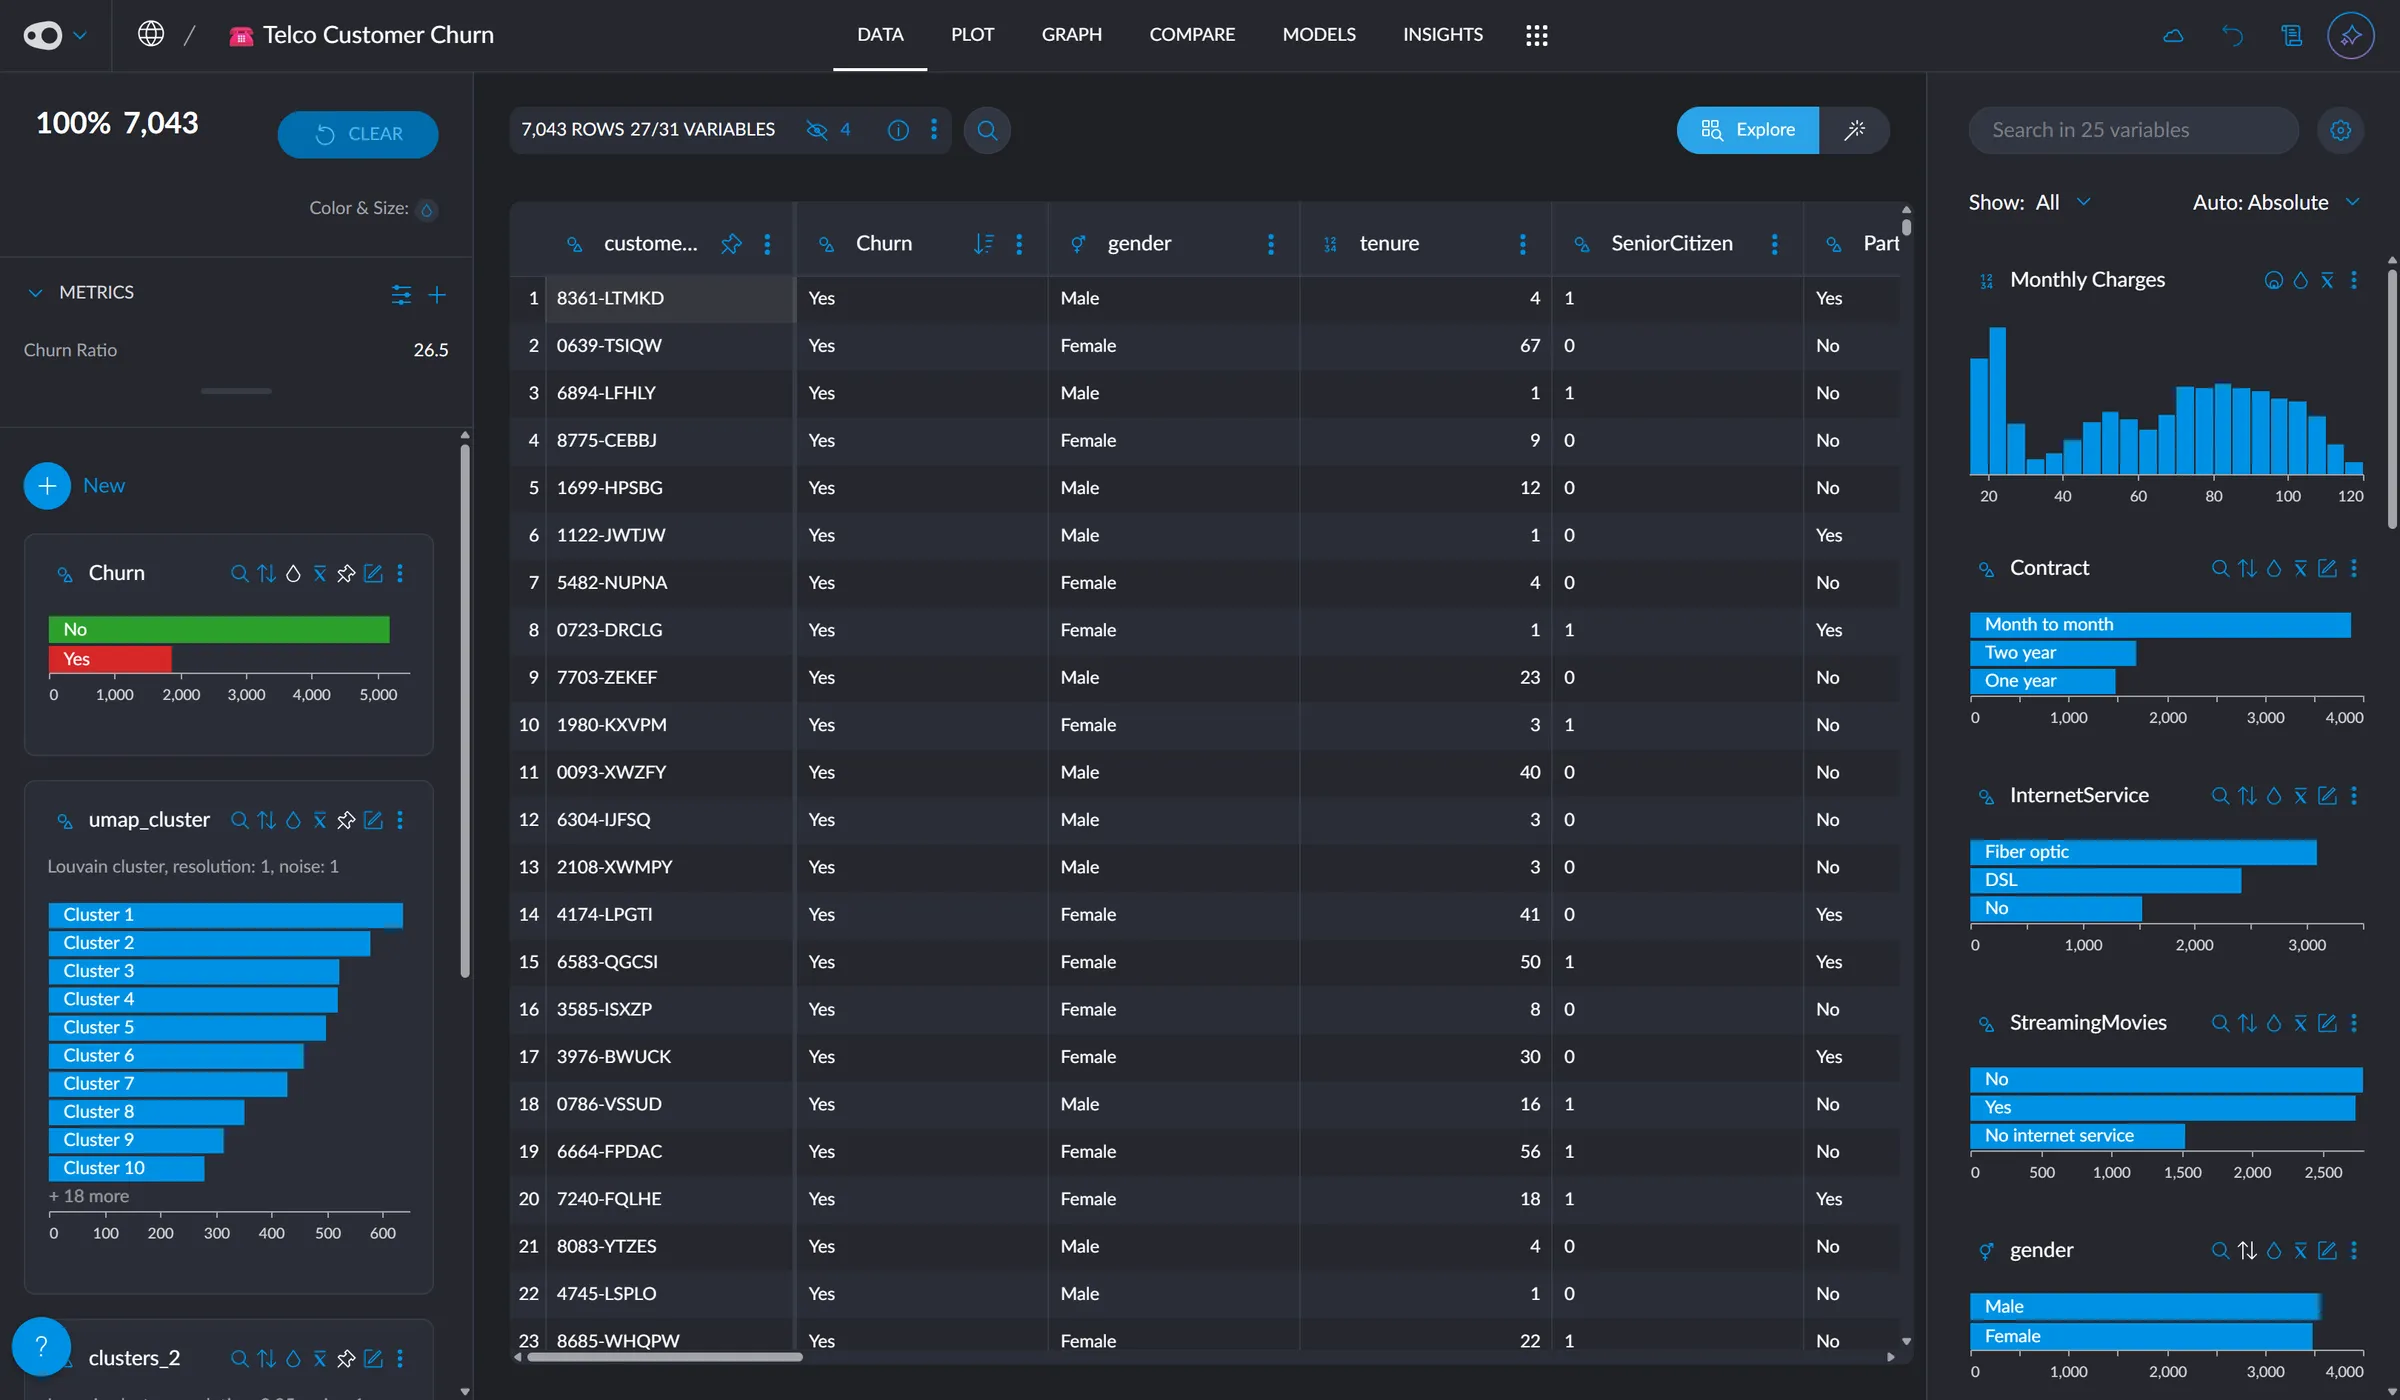
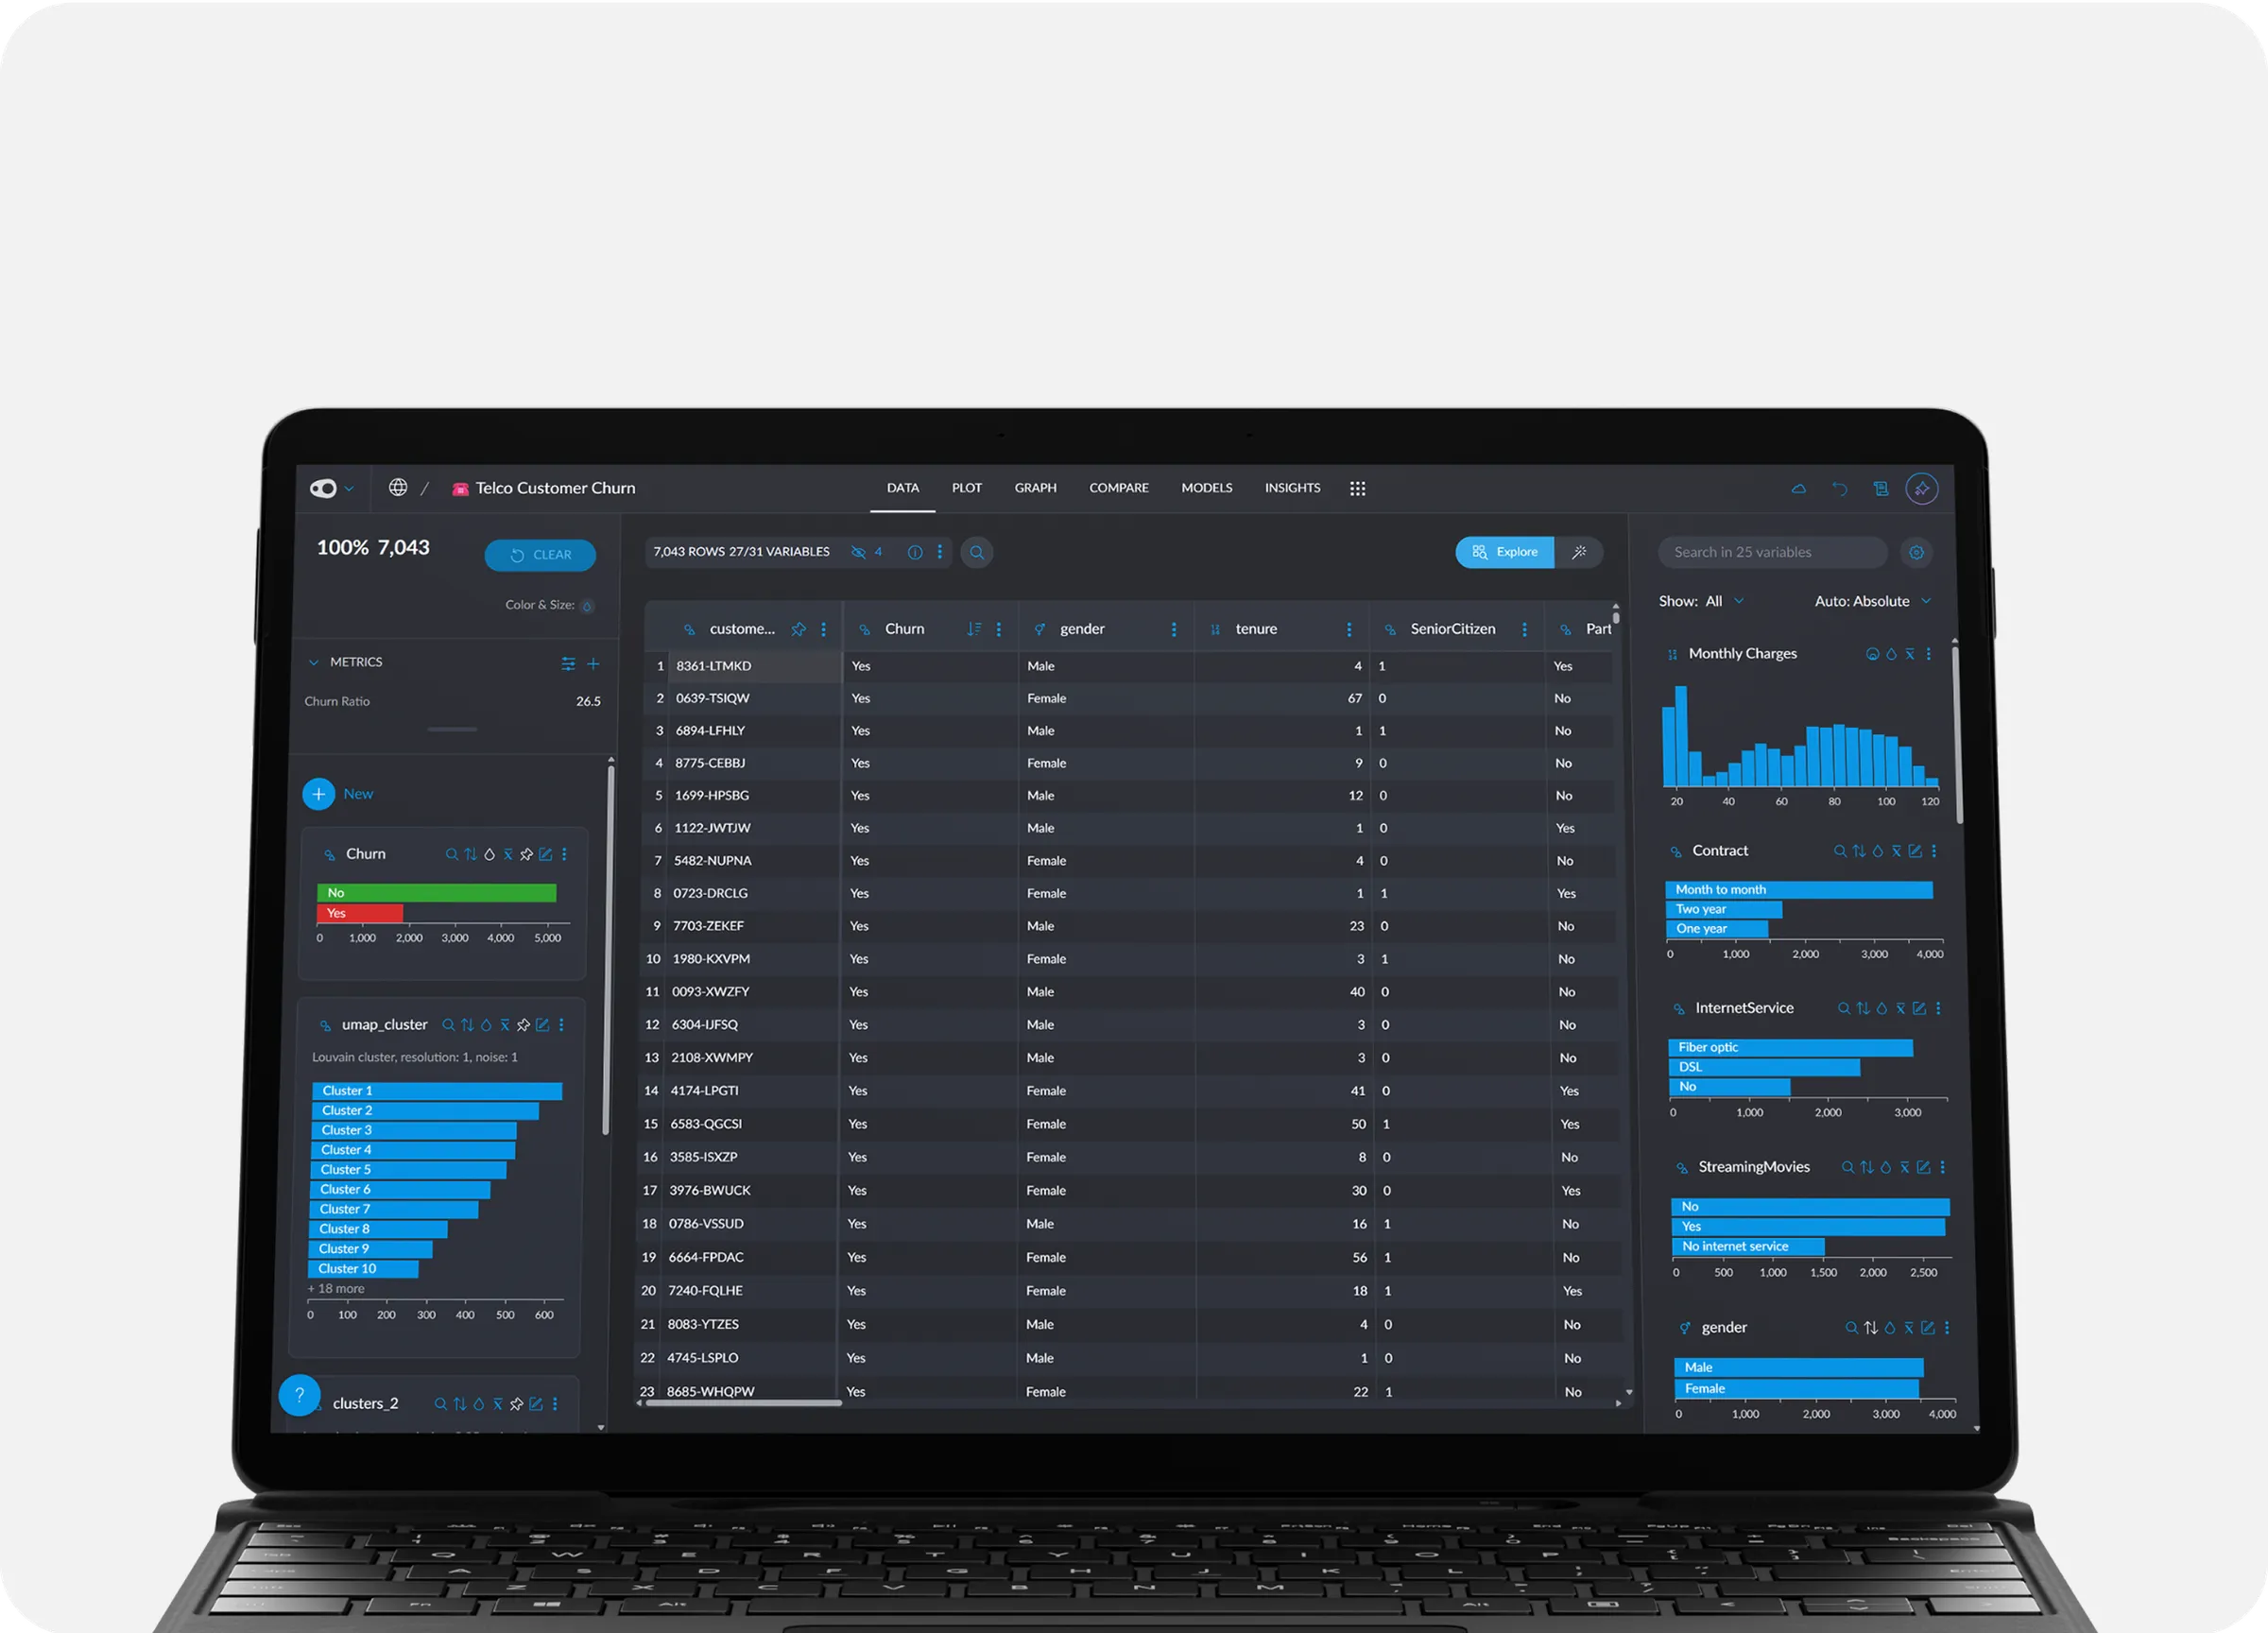
Define calculation with prompt:
Which metric best shows how well my predictive models match real customer behavior?
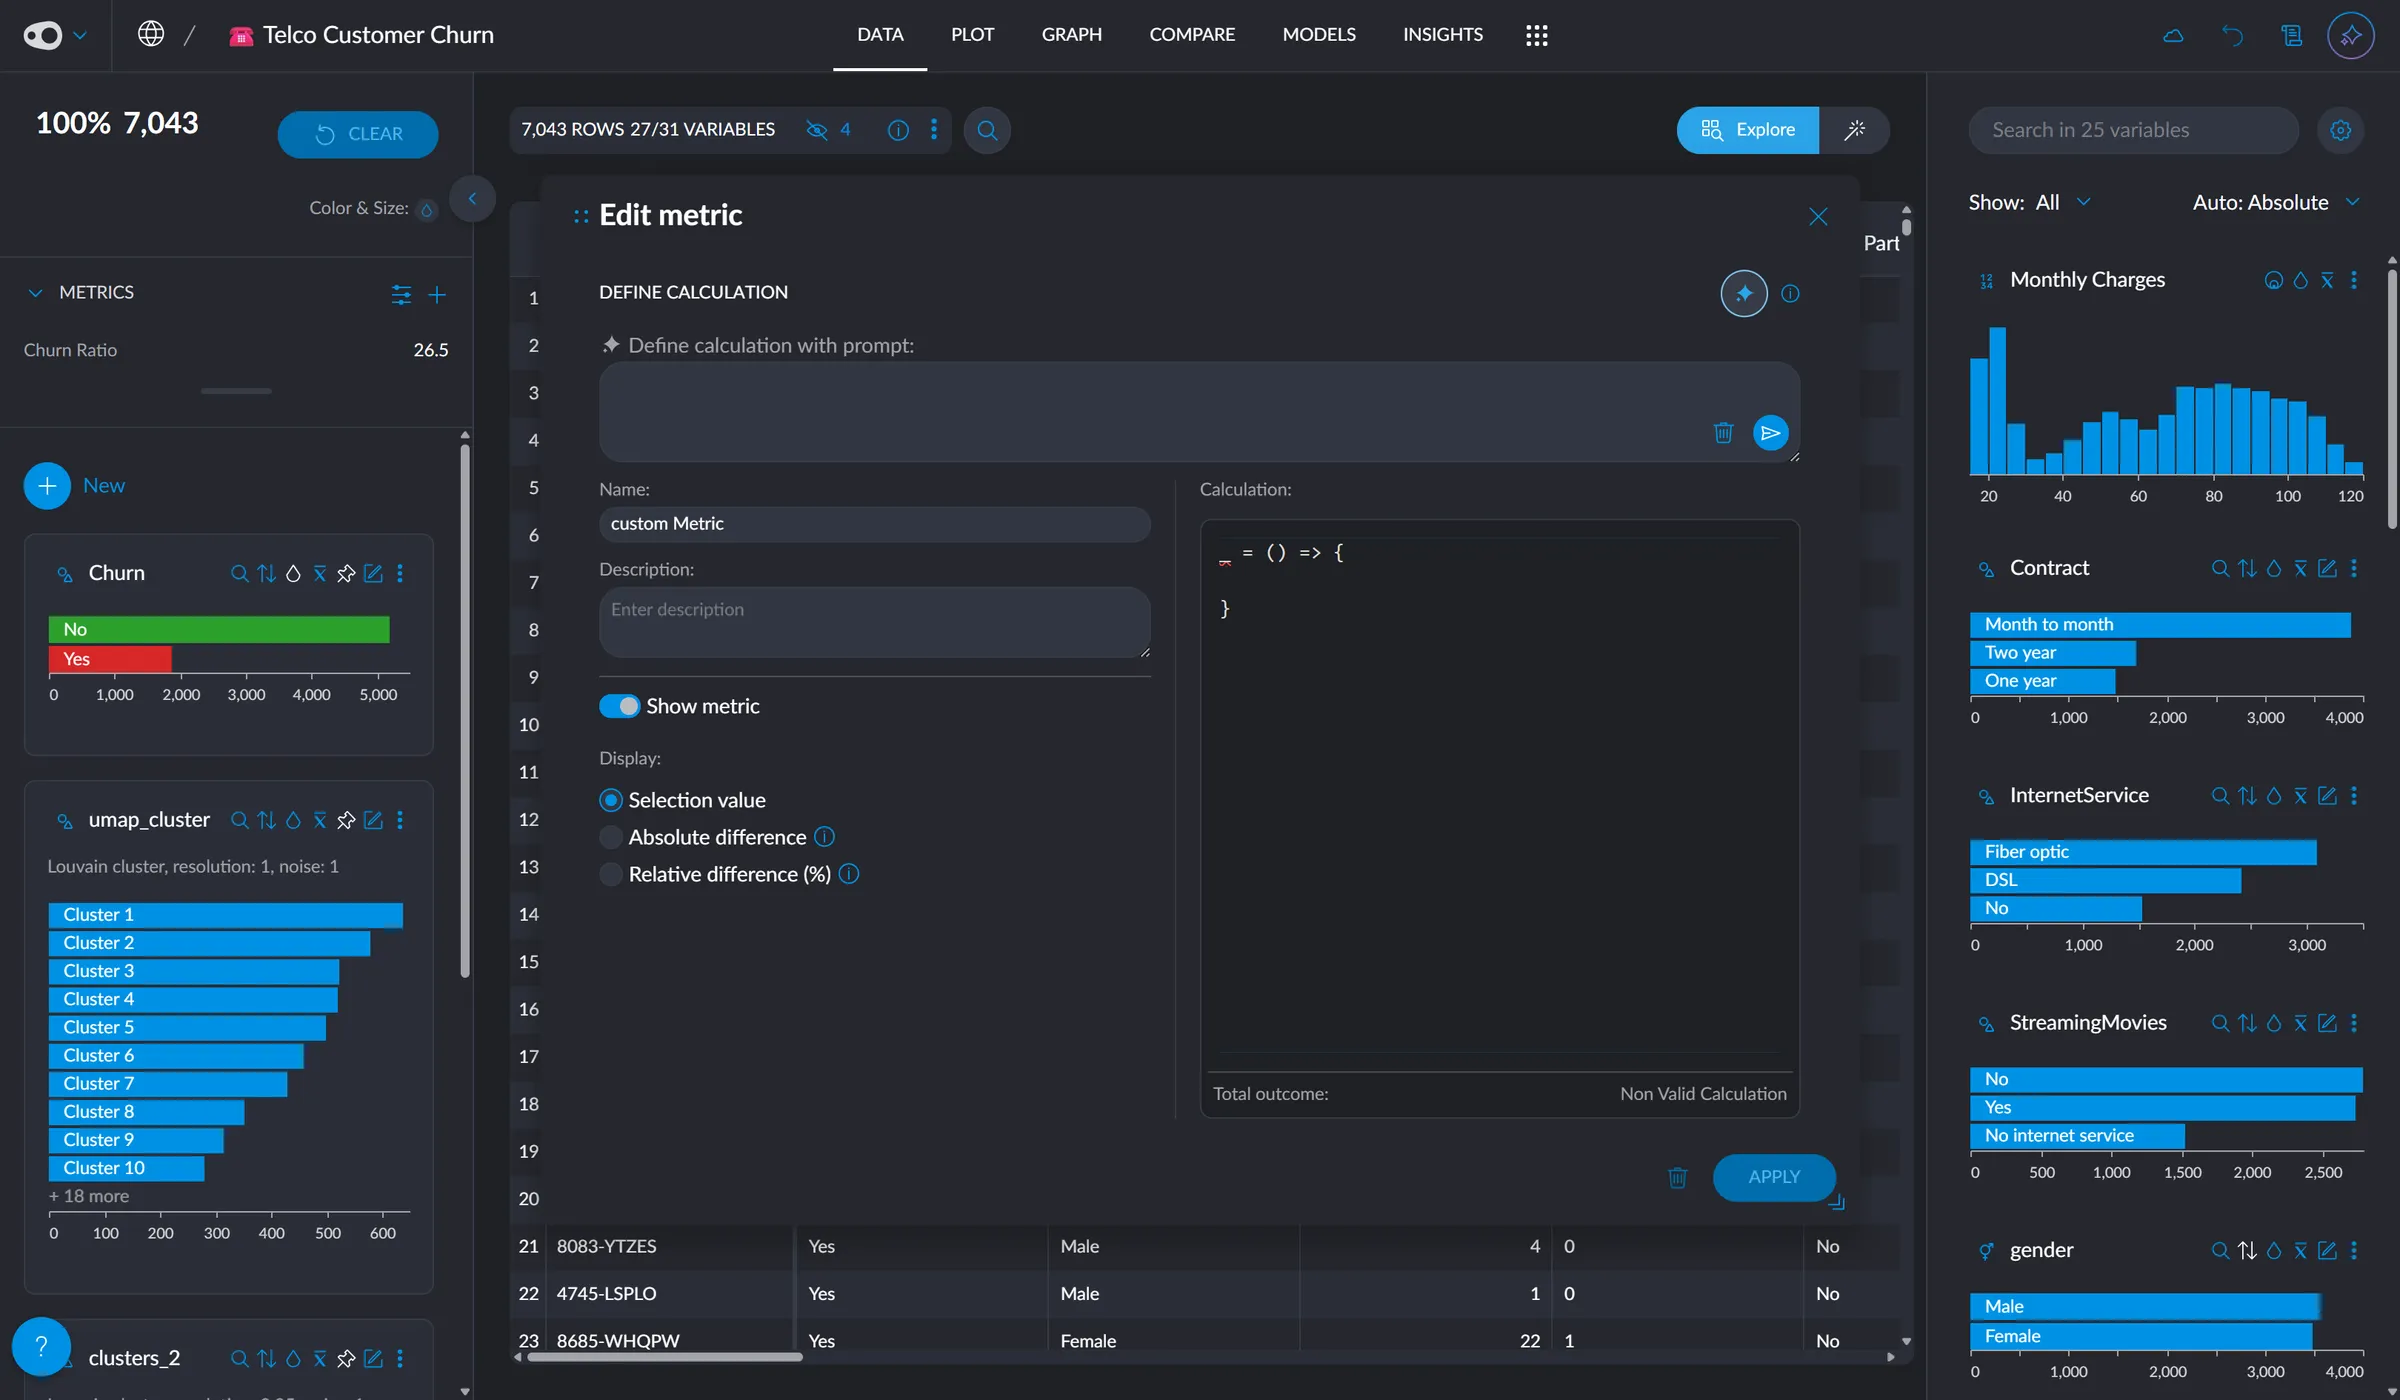
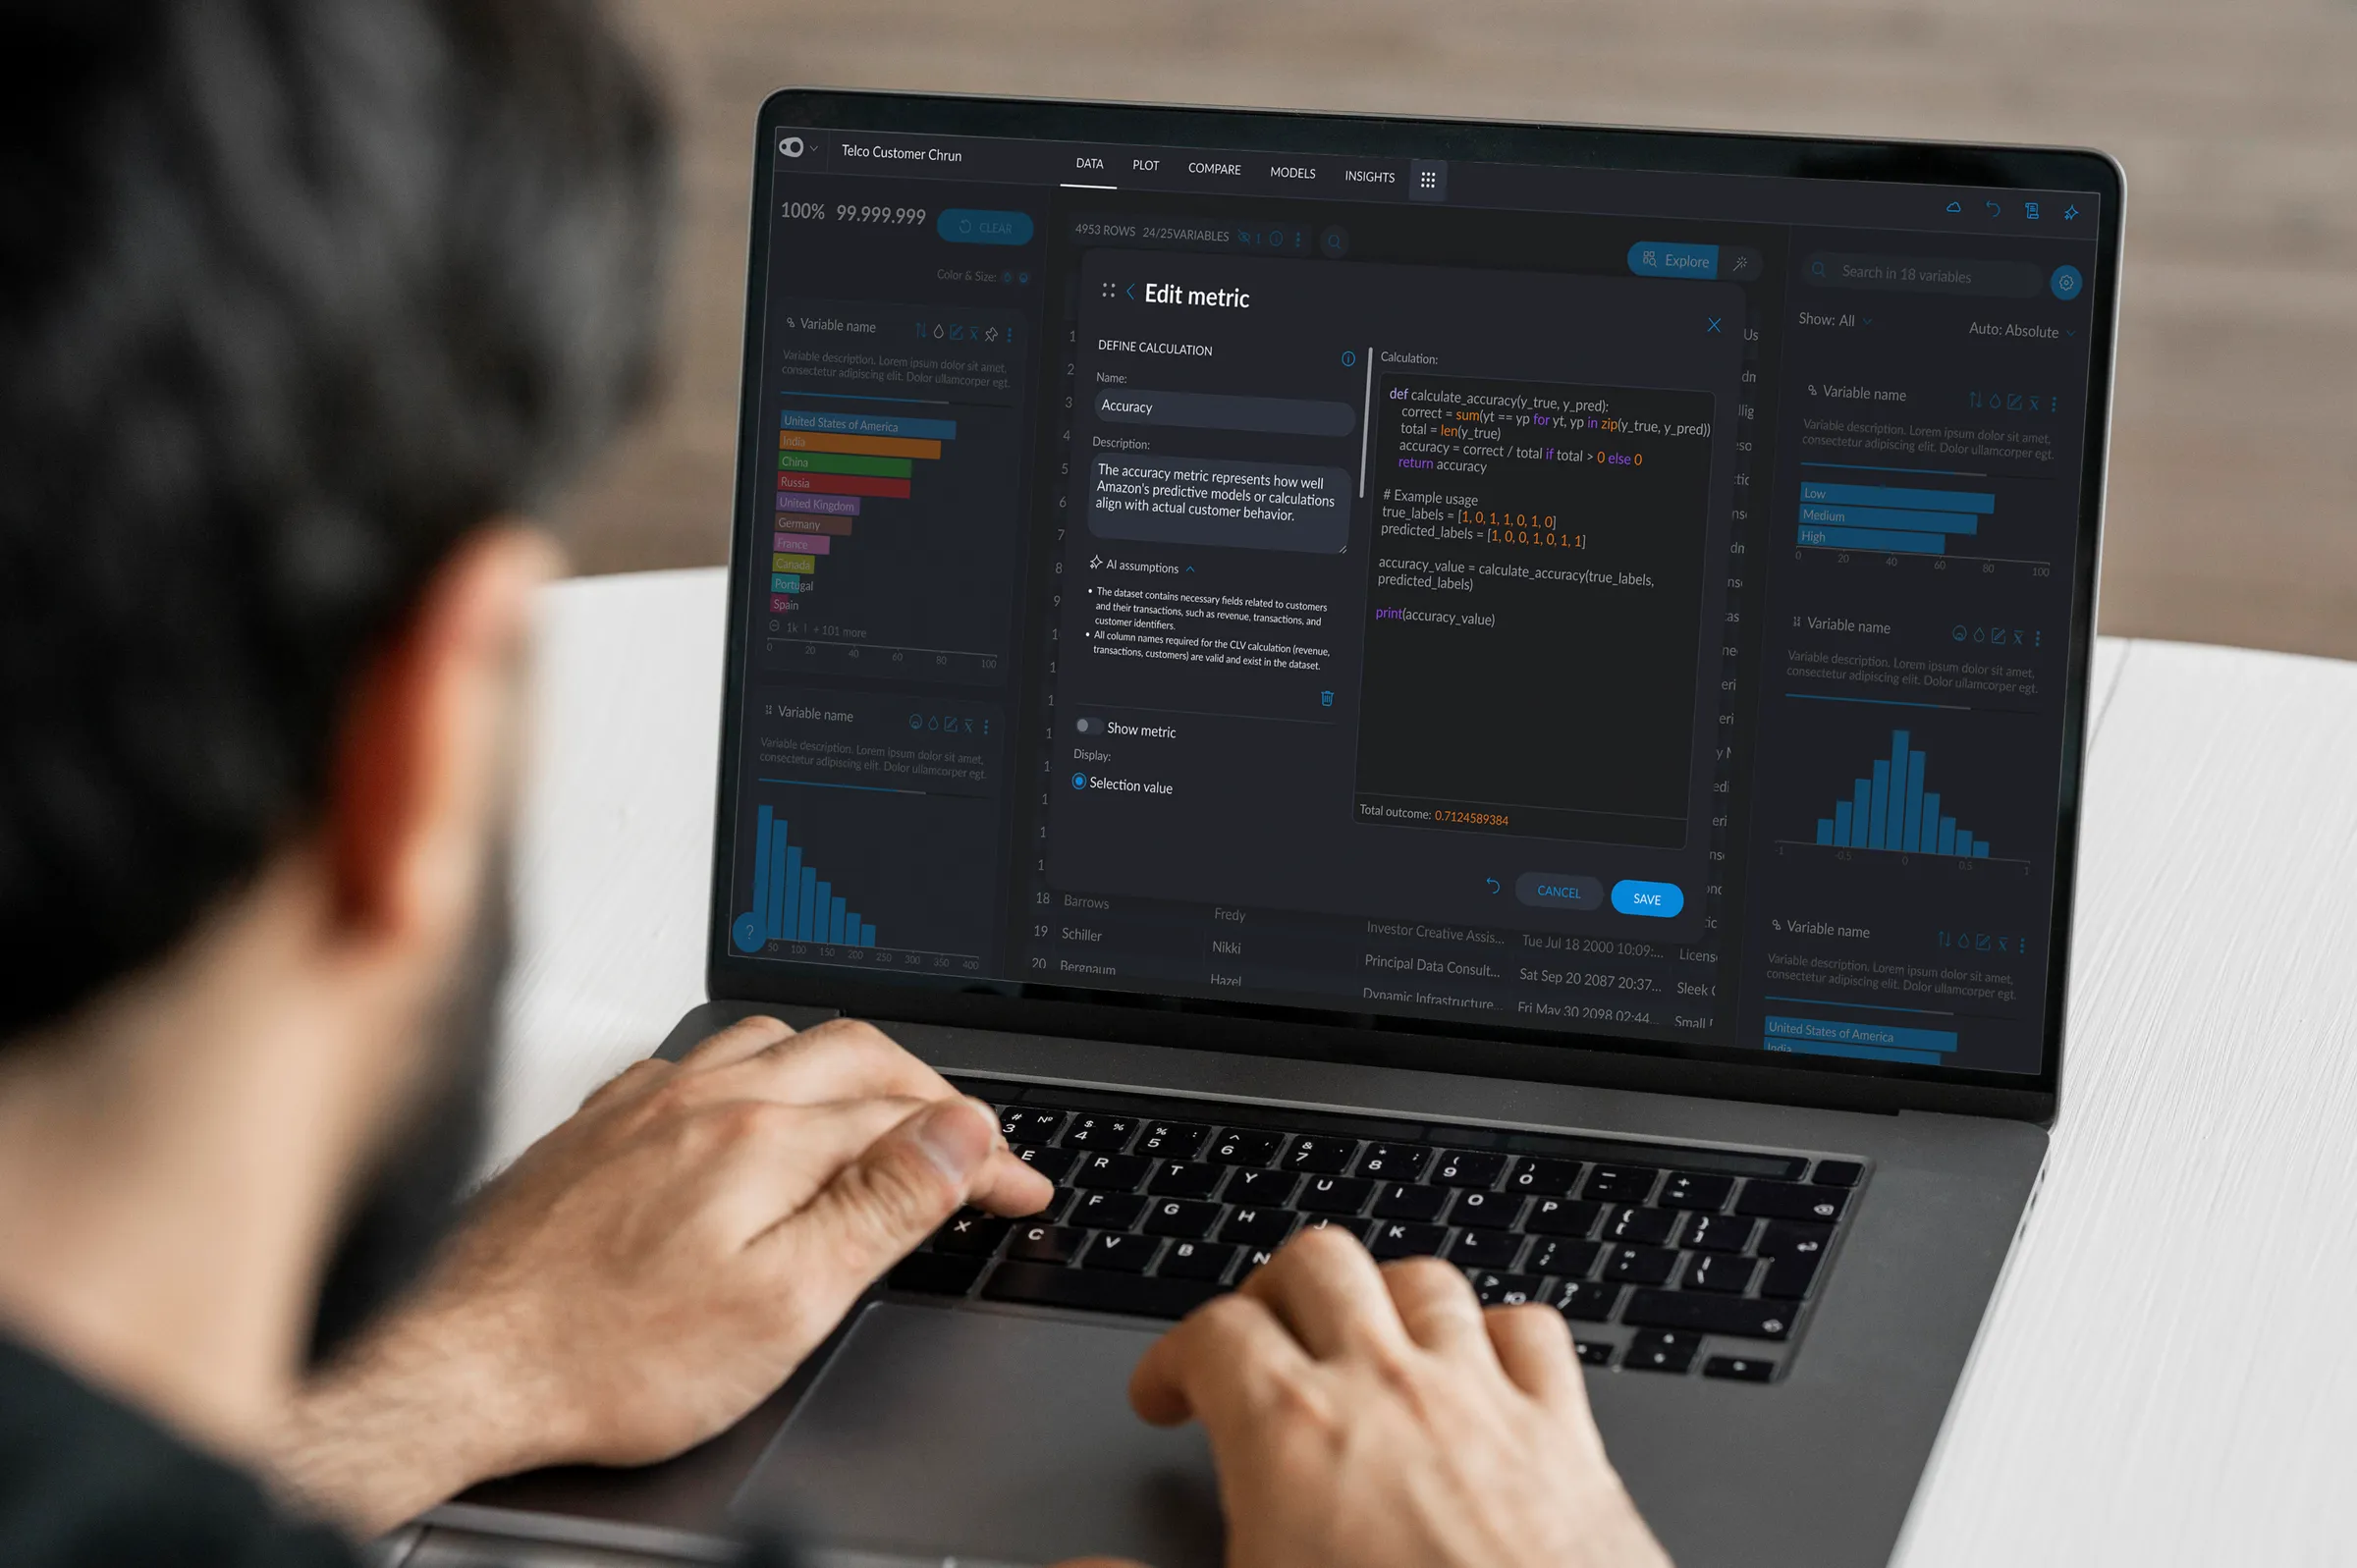
Key design decisions included:
User feedback showed increased confidence in data exploration, thanks to AI guidance when users were unsure where to start. Fewer support tickets about metric creation indicated the feature effectively solved a major pain point, helping Graphext empower non-technical users to extract valuable insights independently.